John Abbott College, Computer Science Technology, Winter 2024
CropCare
Our final-year capstone: a Raspberry Pi container farm, Azure IoT Hub and a .NET MAUI app, built by three students who really wanted to beat their friends' team. I built the app's monitoring and control screens, its live charts, and three of the farm's sensor drivers.
- Type
- Capstone project
- Timeline
- March to May 2024
- Stack
 Python
 Raspberry Pi
 Azure IoT Hub
 MQTT
 C#.NET MAUI
 Firebase
 GitHub
- My focus
- Mobile app and sensor drivers
- System
- Raspberry Pi → IoT Hub → MAUI
- Team
- Three developers
Context
A final-year capstone that had to be designed first
CropCare was our capstone for John Abbott College's Computer Science Technology program, built over the Winter 2024 semester by Cristiano Fazi, Kevin Baggott and me. This was pretty much pre-ChatGPT, which was barely usable back then. The program is hands-on: you do everything yourself, and you do it properly. Two courses fed into it: Application Development 3 taught cross-platform mobile development in .NET MAUI, and Connected Objects taught Python, Raspberry Pi hardware and Azure IoT.
We set the brief ourselves: a container farm an owner or technician can monitor and control from their phone, covering growing conditions, the enclosure's security, and its location. We also had a friendly rivalry going with friends in another group over who'd have the better project. So we went all out, way past what the courses asked for.
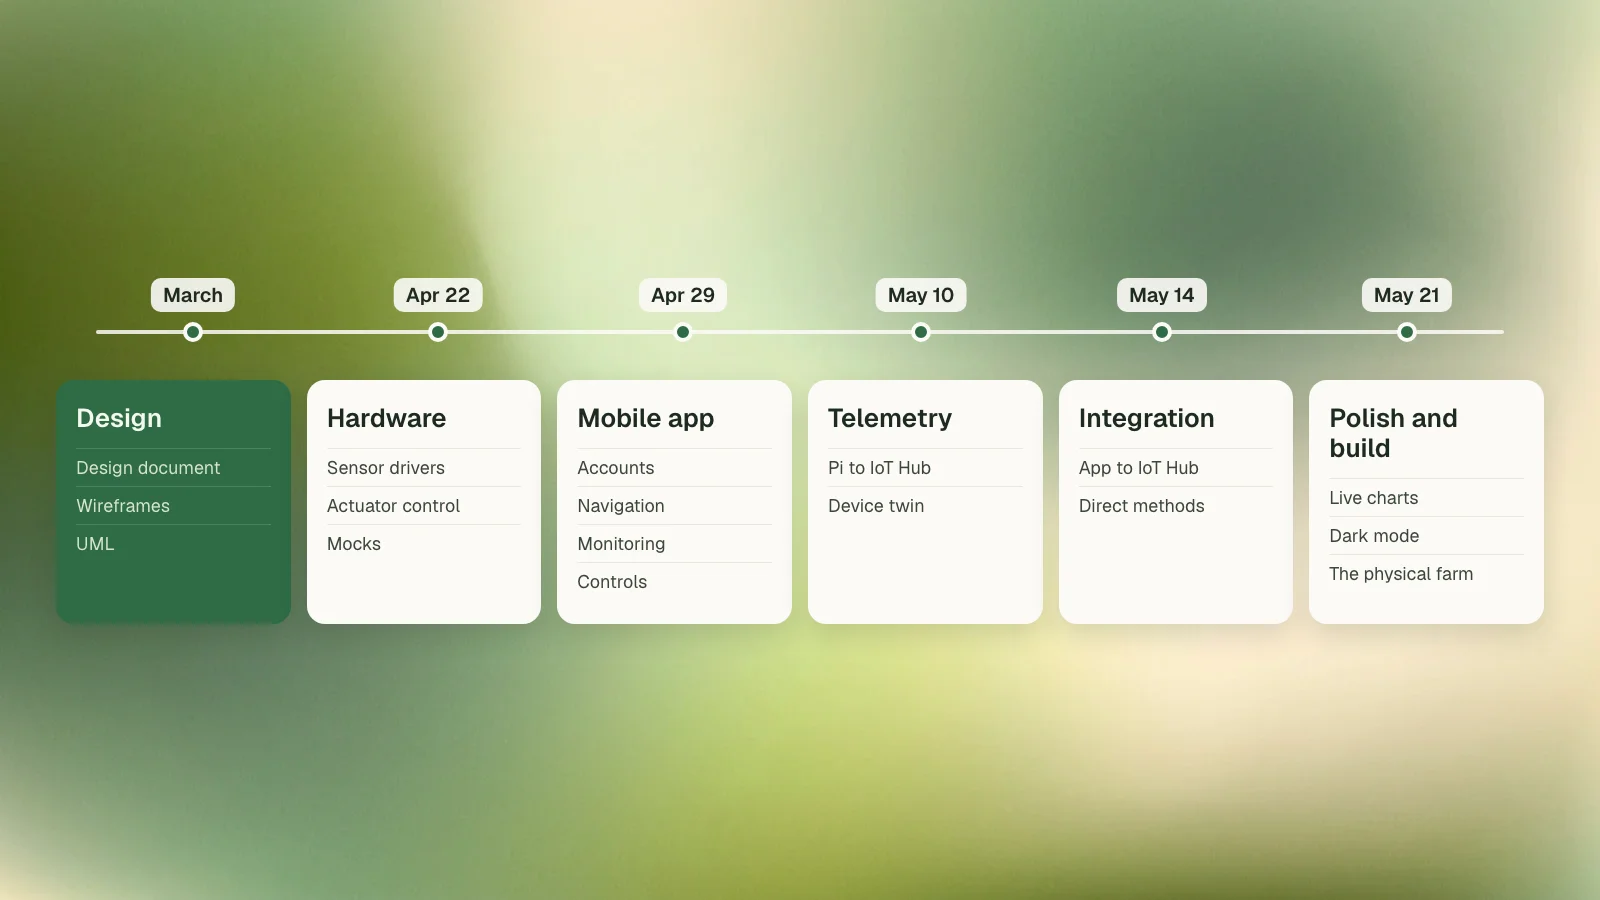
The program made you design before you code. In March we wrote a design document, wireframed every screen and drew the UML ourselves. Then the build ran in phases, each with a due date: hardware drivers by April 22, the mobile app by April 29, telemetry to Azure by May 10, the app's link to IoT Hub by May 14, and polish and the physical farm by May 21.
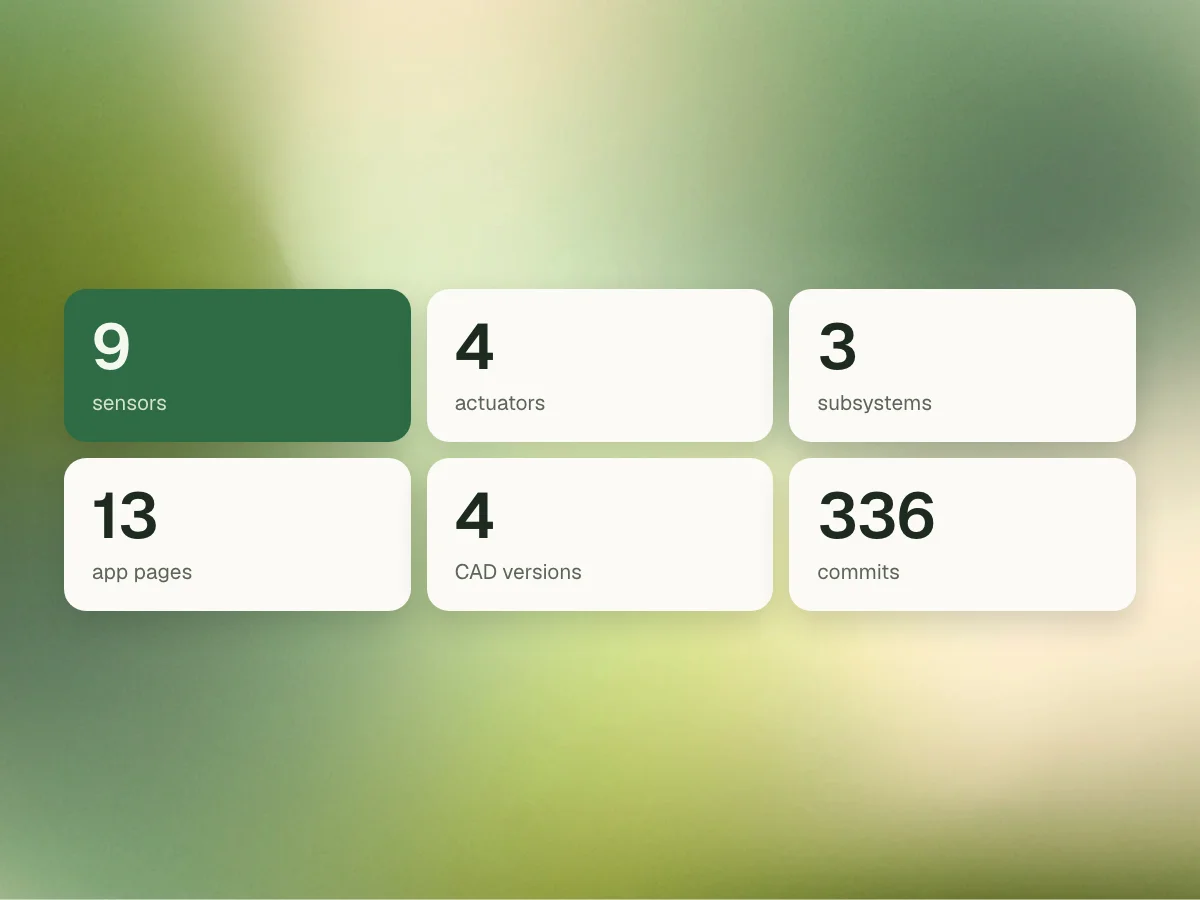
The physical farm was one of the most fun parts. I modelled the enclosure in TinkerCAD across four versions, and we built it out of wood, plexiglass and hinges, with a servo locking the door and an actual plant inside.
My contribution
The app's screens, its live charts, and three drivers
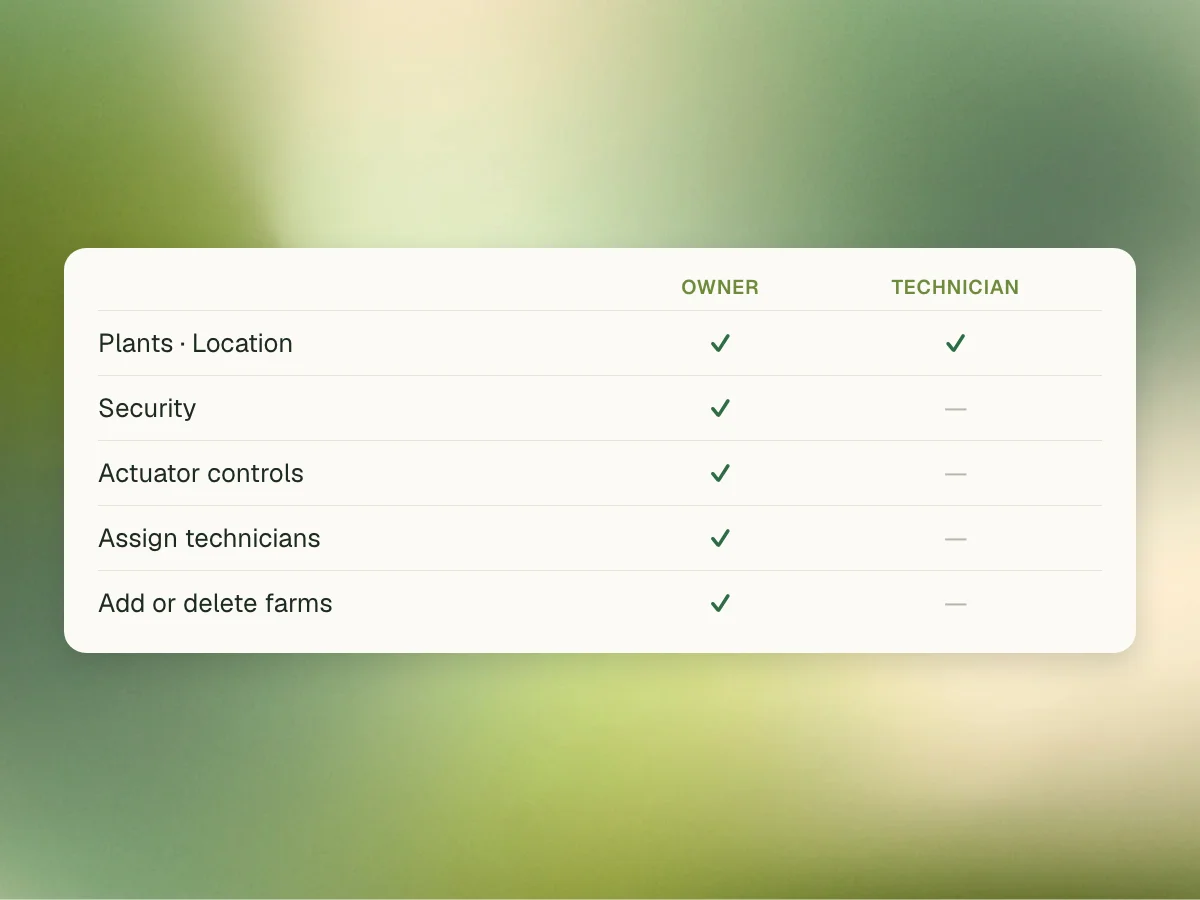
In the app, I built the Plants and Security pages, fan and LED control, the owner and technician account types (technicians don't get the controls), and the dark theme.
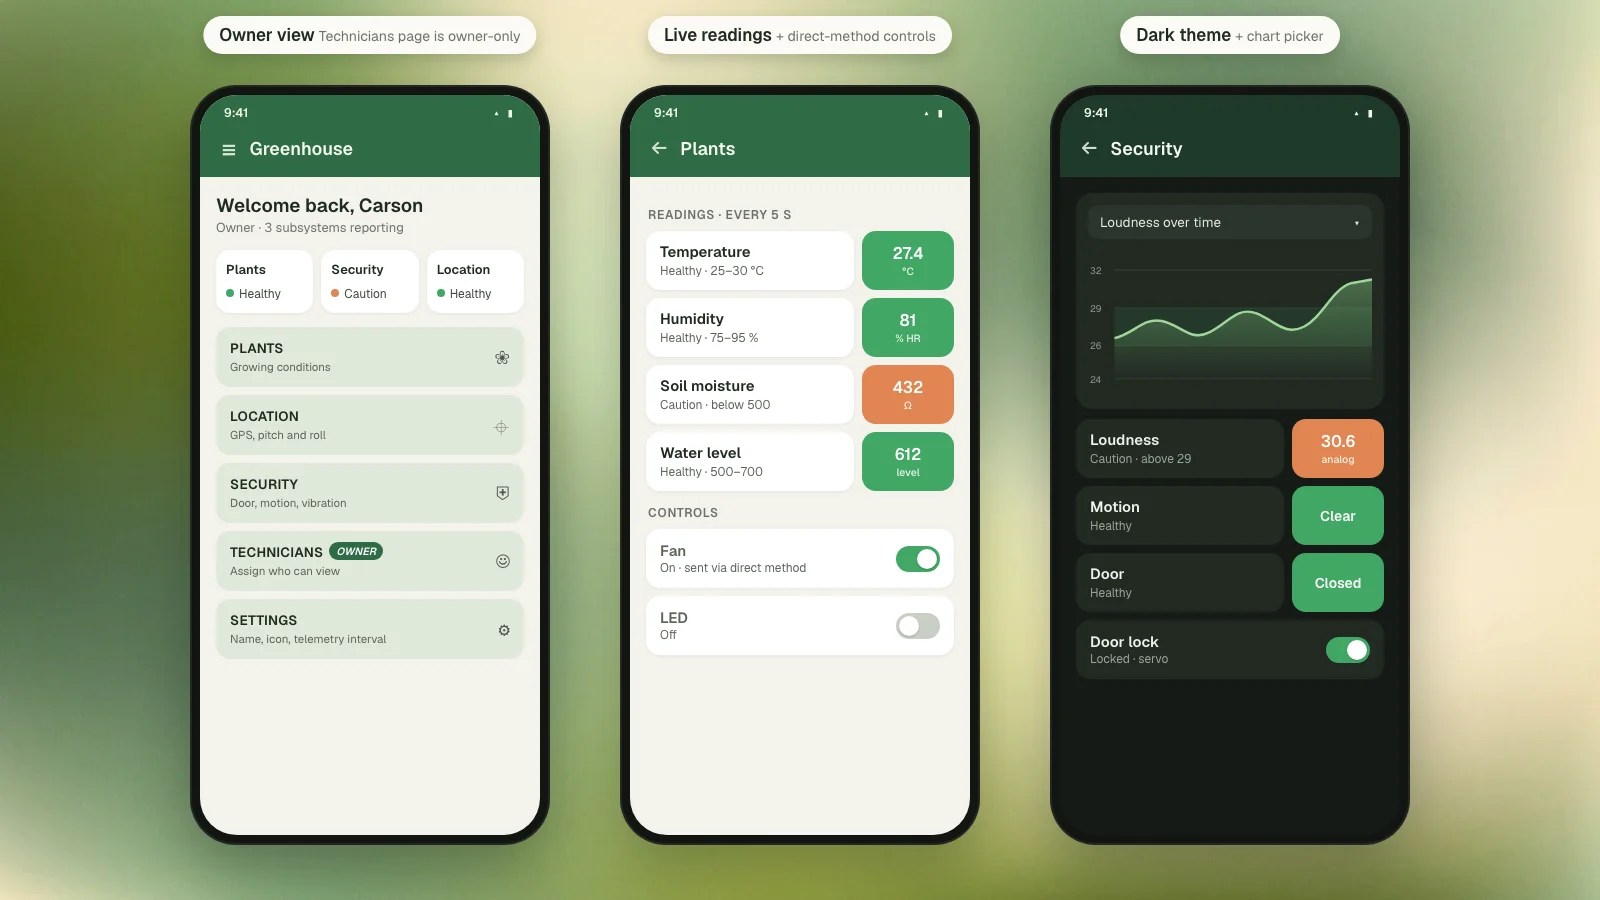
I also added the live charts. Each controller keeps a reading history per sensor and redraws a LiveCharts line on every message, and a picker lets you choose which sensor to plot.
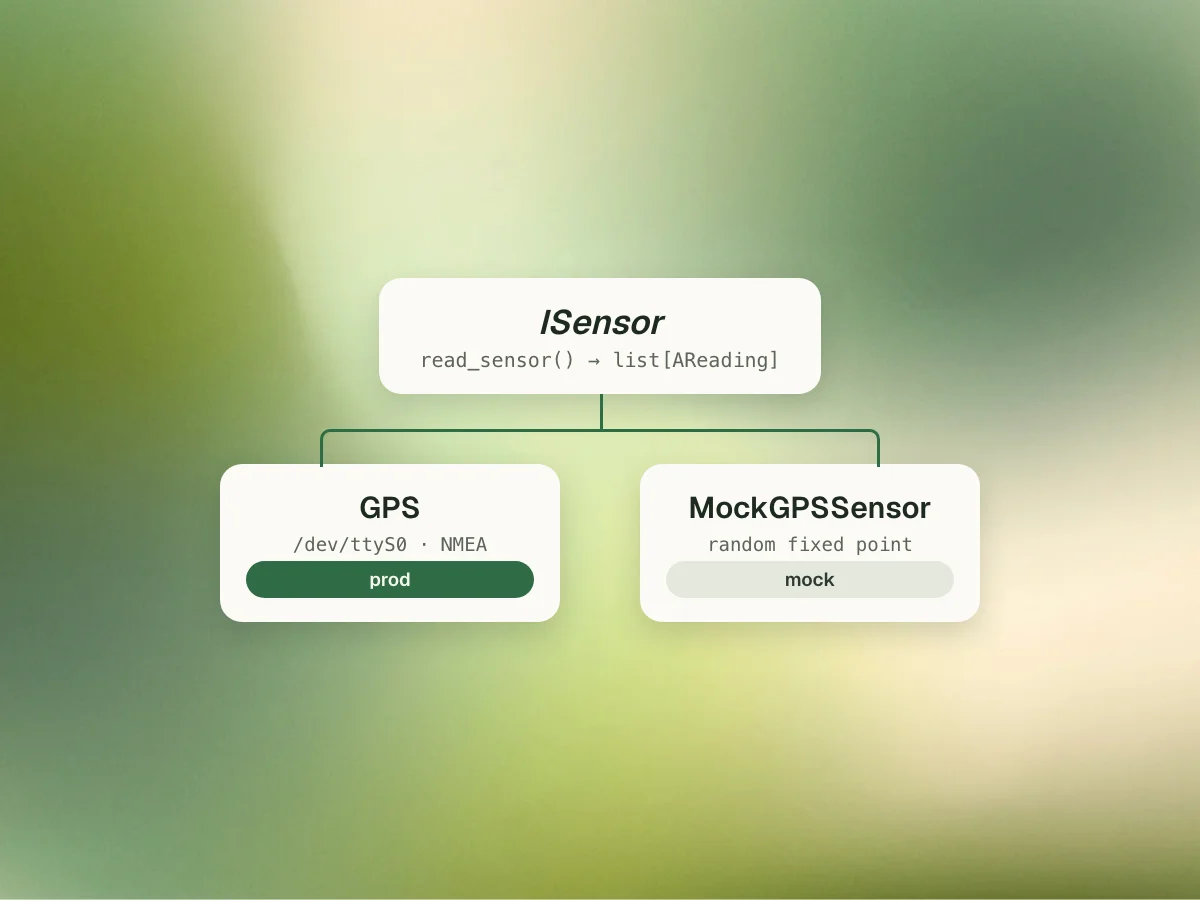
On the farm side, I wrote the loudness, vibration and GPS drivers, each with its own mock. The GPS took the most work: it reads NMEA sentences from the Pi's UART at /dev/ttyS0, and it only worked after we changed the Pi's serial port config. I also drew the team's UML in Mermaid and wrote the hardware port guide.
System
One device ID ties three runtimes together
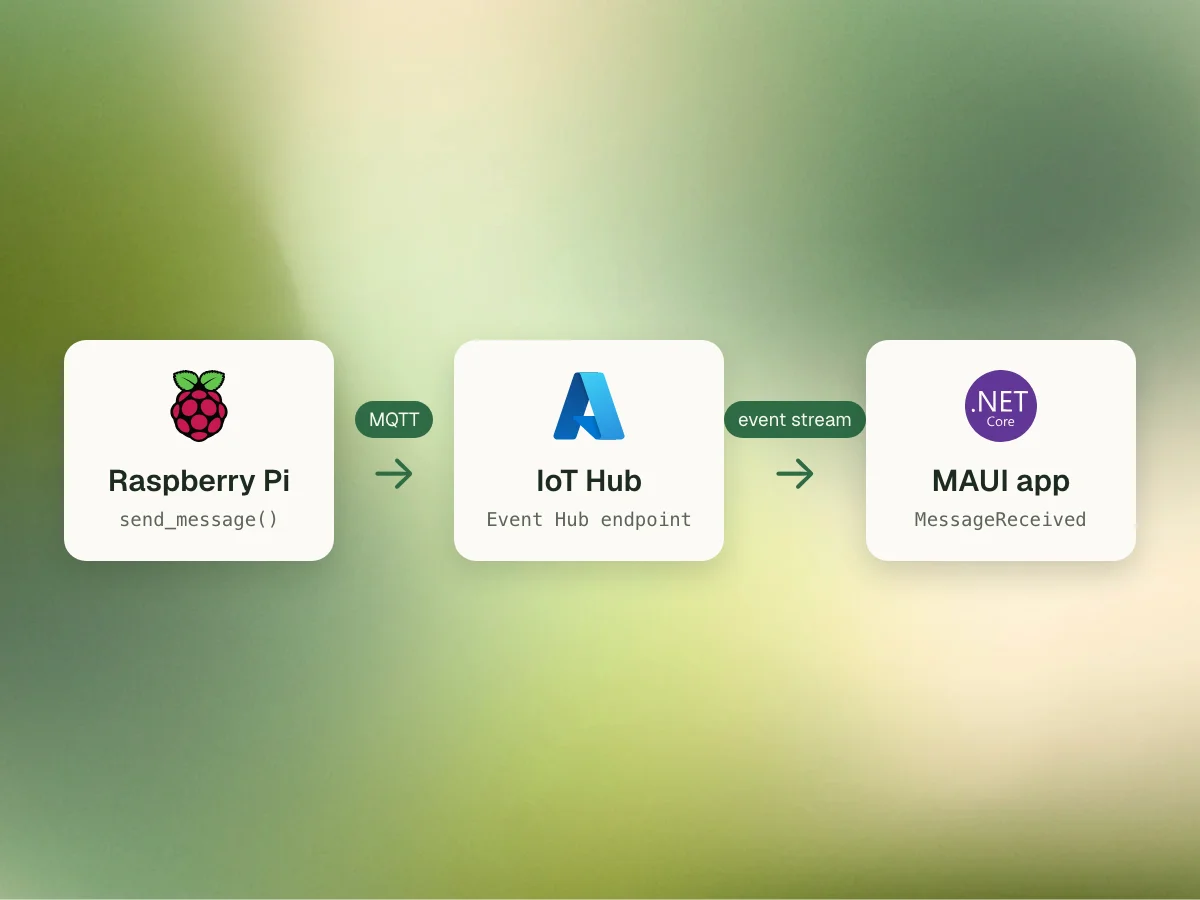
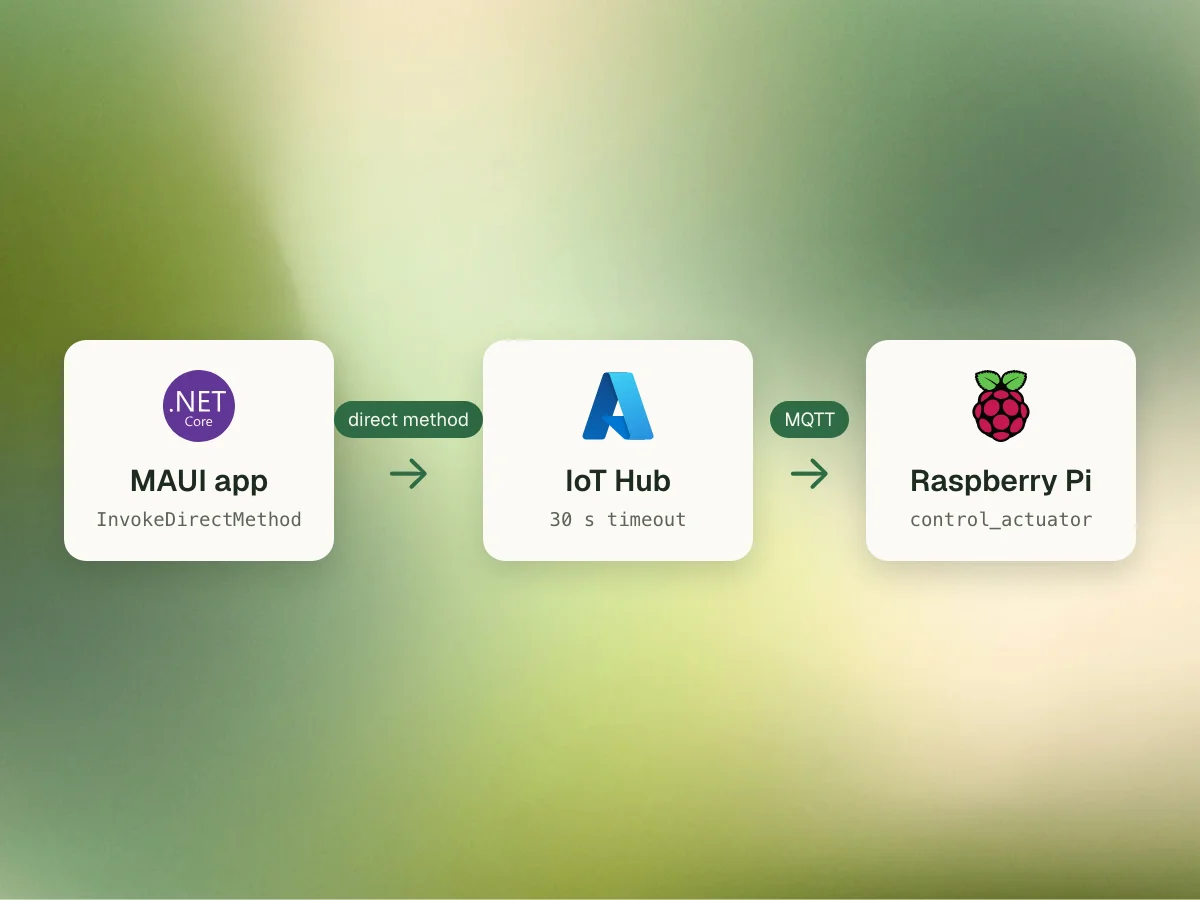
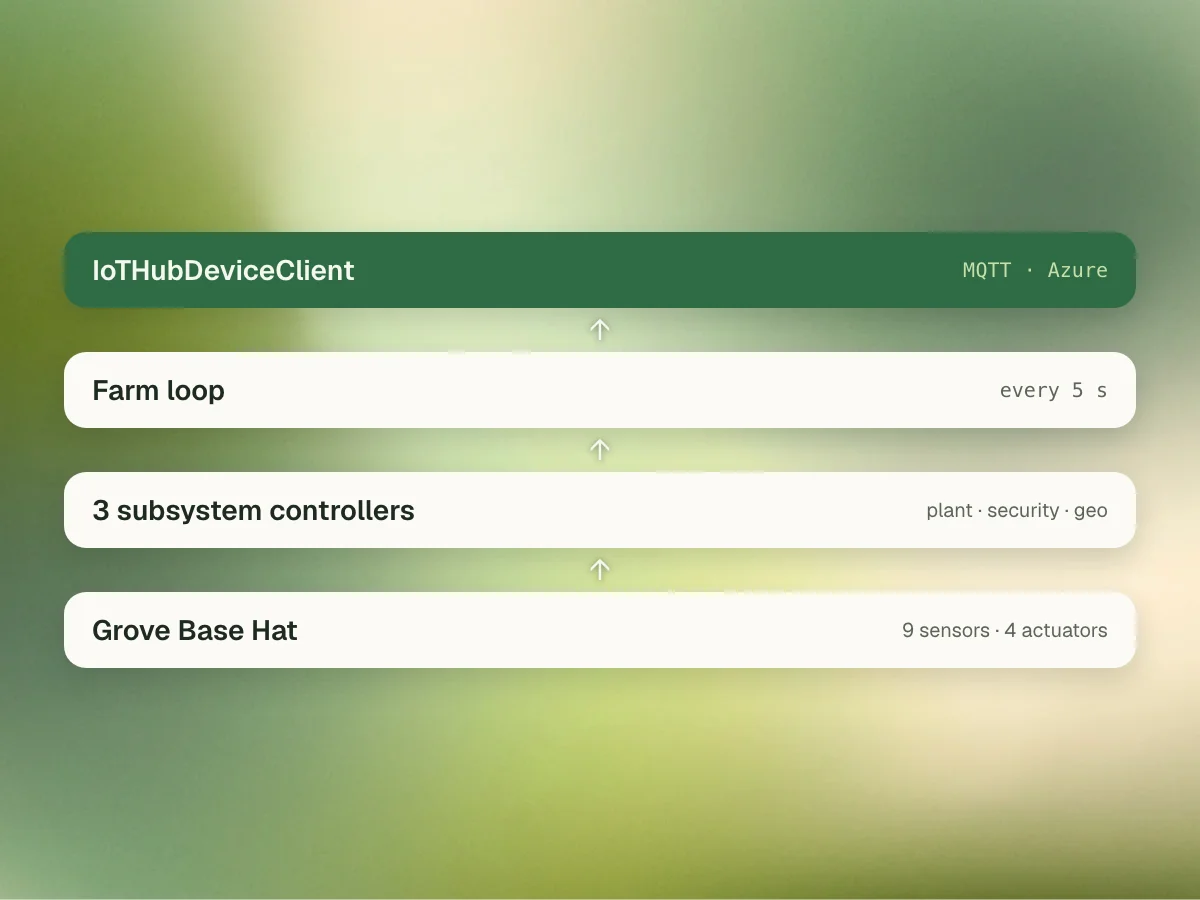
The farm runs in Python on a Raspberry Pi reTerminal and sends every reading to Azure IoT Hub over MQTT through Azure's device SDK, every five seconds by default.
The app pulls those readings from IoT Hub's built-in Event Hub endpoint and sends commands back down as direct methods. Each farm record in Firebase stores its IoT Hub device ID, and that's how the app knows which farm on screen a stream of events belongs to.
The Raspberry Pi
Three subsystems behind one interface
A Grove Base Hat connects the sensors and actuators to the Pi. We followed proper design here: every sensor implements ISensor and every actuator implements IActuator. Plant, security and geolocation controllers own them, and a Farm class reads all three every five seconds.
An ENVIRONMENT_MODE variable swaps every driver for a mock behind the same interface, so the whole pipeline runs on a laptop with no hardware plugged in.
Commands come in as direct methods. A request processor maps a method name like control_actuator to a handler, and each command goes to the first actuator that accepts it. The app can also change the reading interval through the device twin.
The app
From an event stream to a health colour
Every incoming event names its device ID, and the app routes it to the farm that owns that device. Three C# controllers mirror the Python subsystems, so a reading lands in the controller that knows what it is.
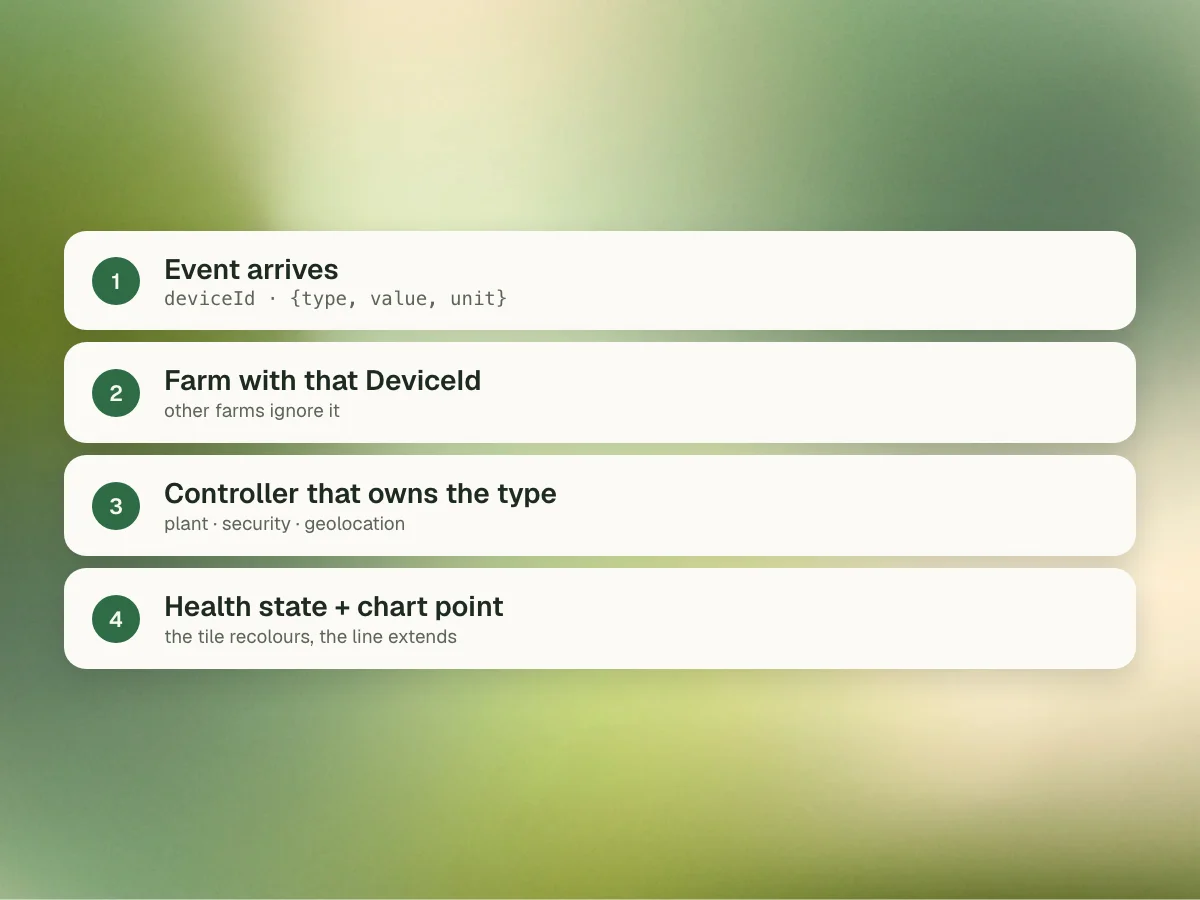
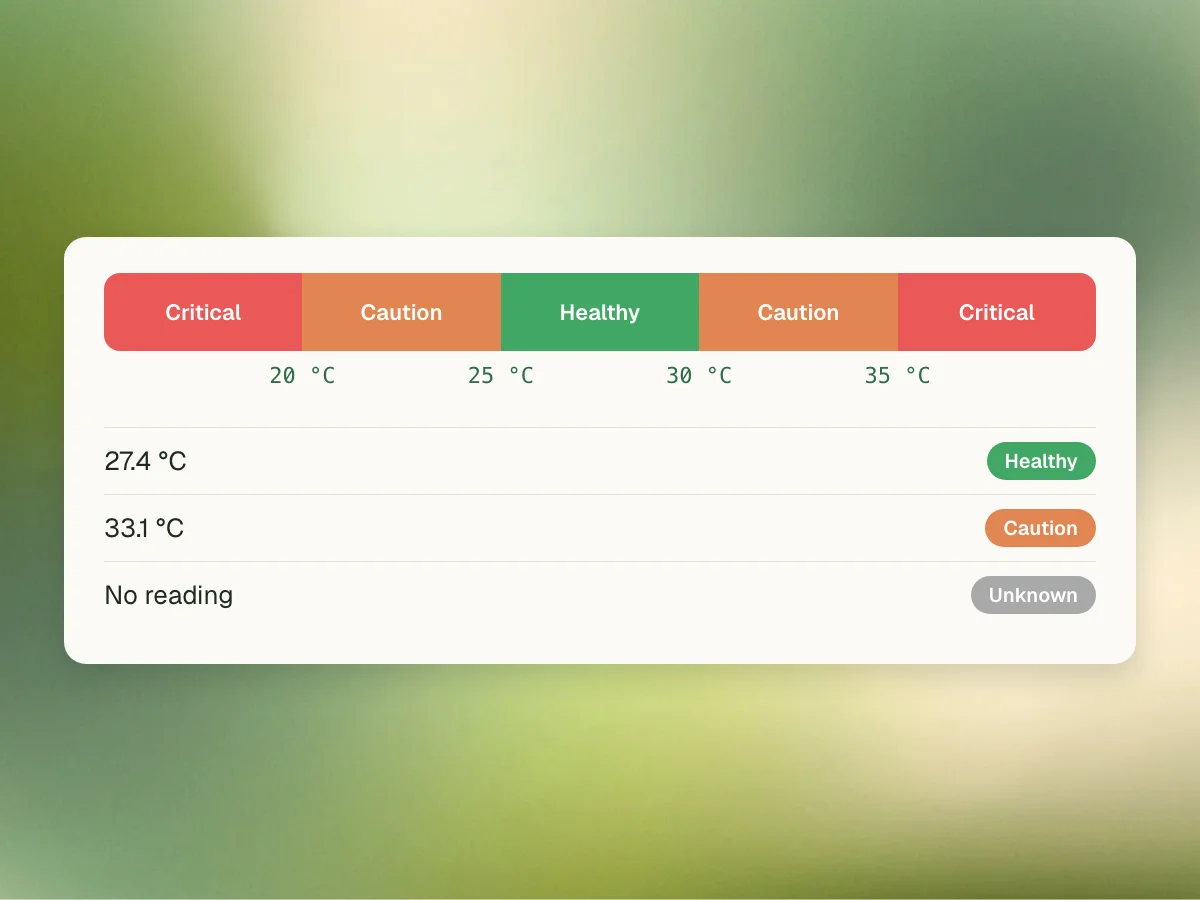
Each controller checks a reading against healthy and caution ranges. For temperature, 25 to 30 °C is healthy, 20 to 35 °C is caution, and anything else is critical. The farm shows its worst state, and value converters turn each state into a colour and a label.
Flipping a switch sends a direct method with a 30-second timeout. With no network, the switch flips back, and if the connection drops, every reading resets to “No data” instead of leaving stale values on screen.
Accounts and data
Owners, technicians, and the farms between them
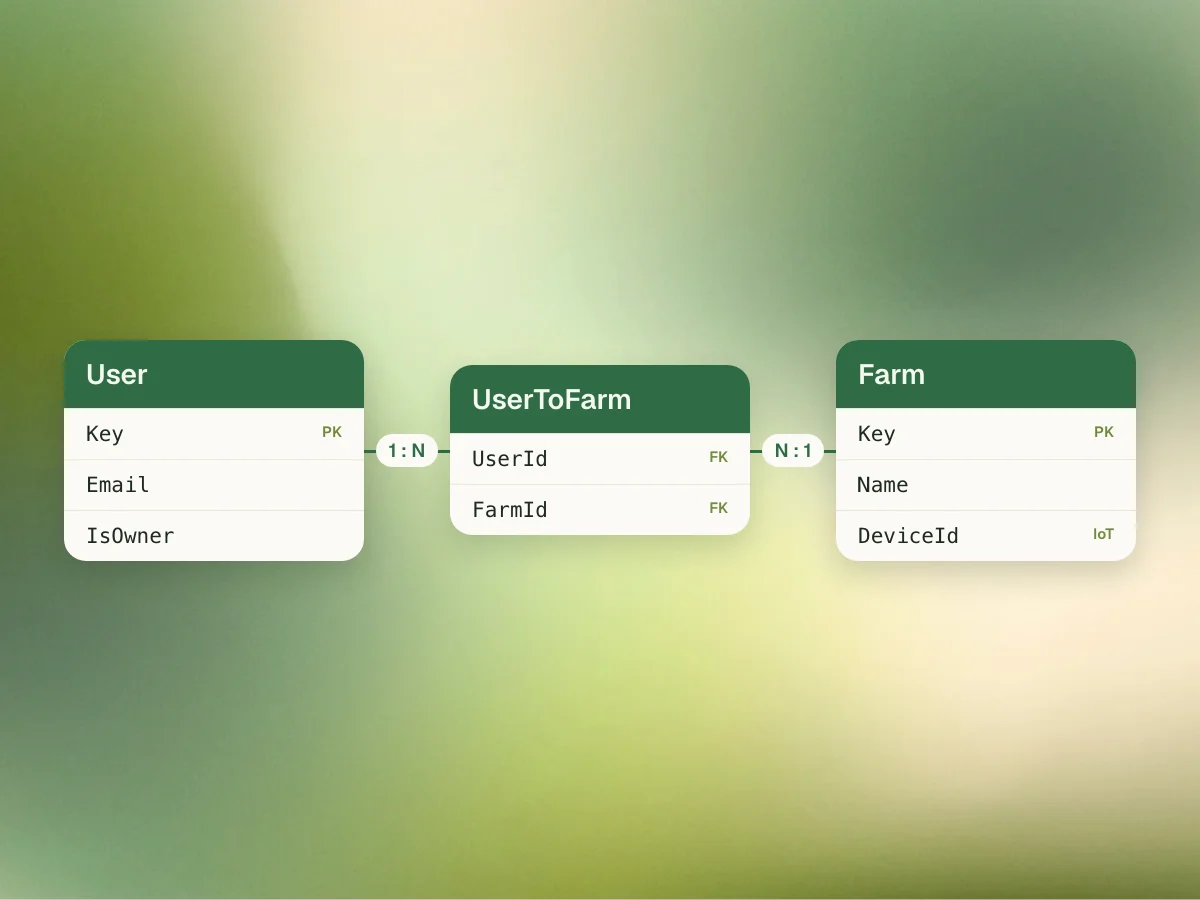
Firebase Auth handles sign-in, and the Realtime Database holds three collections: users, farms, and a UserToFarm join between them. A generic DatabaseService<T> implements IDataStore<T> for any keyed model, so all three share the same code.
Every account is either an owner or a technician. I built that split: owners add and delete farms and assign technicians, and technicians see Plants and Location without any of the controls.
Outcome
A working farm, and the record of how it was built
The final build streamed readings from the enclosure to the app and switched the fan, LED, door lock and buzzer from a phone. The GitHub repo is a gold mine if you want to see how it was built, with four CAD versions, the UML, the wireframes and a port guide for every sensor, and you can view the final enclosure in 3D in your browser.
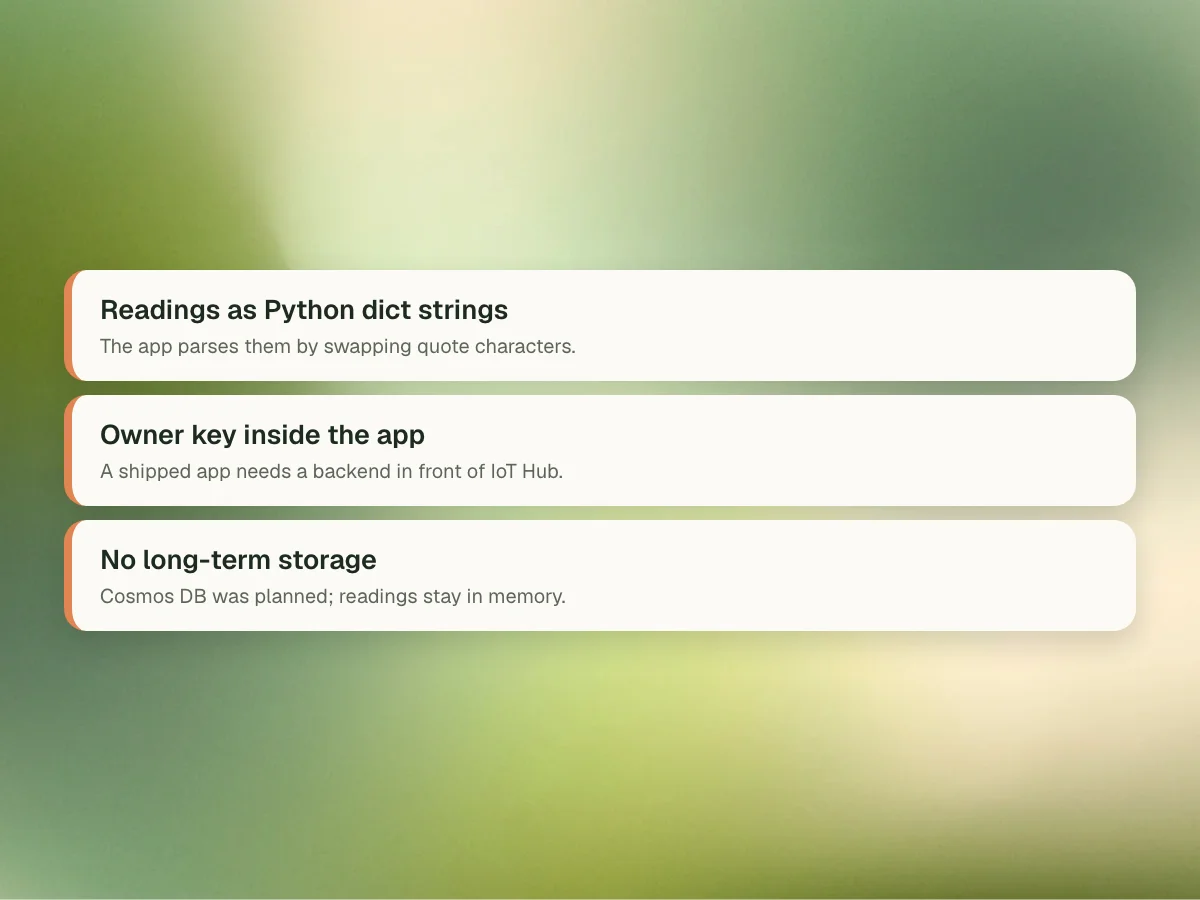
Three shortcuts wouldn't survive production. The Pi sends each reading as a Python dict string, which the app parses by swapping quote characters. The app holds an owner-level IoT Hub connection string, where a real app would need a backend between the phone and the hub. And Milestone 4 planned Cosmos DB for long-term telemetry, but the shipped app keeps readings in memory and charts the last ten.